
Team productivity metrics measure how efficiently a team completes tasks, manages resources, and delivers results. These metrics help organizations assess performance, monitor progress toward objectives, and determine whether teams are operating effectively.
By tracking productivity metrics, managers can identify strengths, uncover areas for improvement, and make more informed decisions about processes, workloads, and resource allocation. Regular measurement also helps teams maintain accountability and focus on achieving performance goals.
This section explores key team productivity metrics, including output and task completion rates, quality of work, project delivery performance, employee engagement levels, collaboration effectiveness, customer satisfaction, and resource utilization. Together, these metrics provide a comprehensive view of team performance and productivity.
Understanding and monitoring these indicators enables organizations to improve efficiency, support continuous improvement, and achieve better business outcomes.
Research on teamwork productivity and effectiveness explains that team productivity depends on multiple organizational factors, including leadership, rewards, training, goals, motivation, measurement, and information technology. The article highlights that effective teams need a shared understanding of tasks, processes, and member roles to perform well. This underscores the importance of team productivity metrics, as organizations need measurable indicators such as output per member, task completion rate, cycle time, rework rate, capacity utilization, team velocity, and customer satisfaction to assess whether teamwork is producing real results.
Output per Member
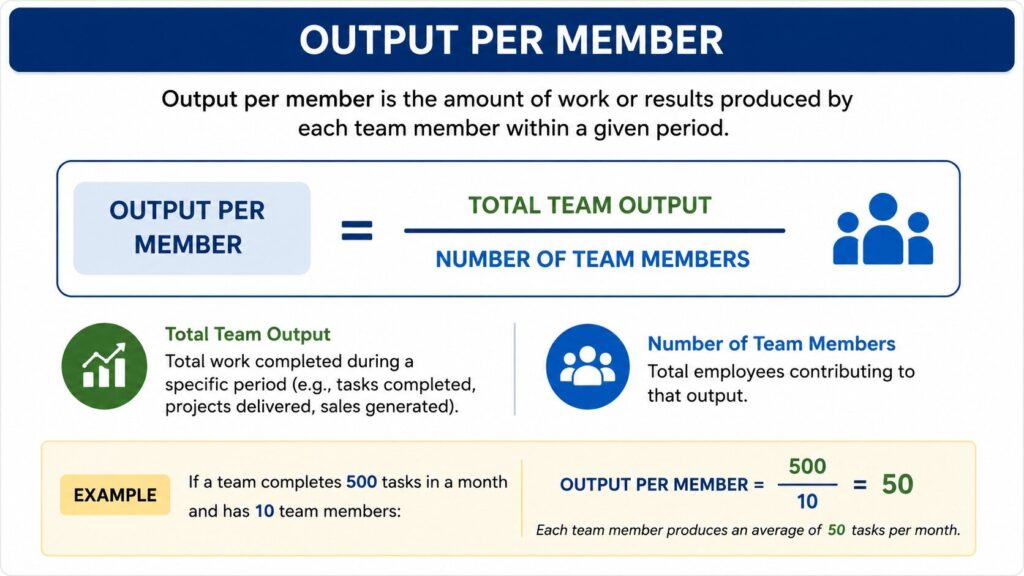
Output per member is a productivity metric that measures the work, tasks, or results each team member produces over a specific period. It helps organizations evaluate how individual contributions support the team's overall objectives and performance.
This metric provides managers with insight into contribution levels, workload distribution, and team efficiency. By tracking output per member, organizations can identify performance trends, recognize high productivity, and assess resource use. They can measure this metric through completed tasks, delivered projects, sales generated, or other role-specific outcomes.
Monitoring each member’s output helps managers distribute work appropriately across the team.Balanced output promotes fairness, prevents excessive workloads on individual employees, and supports continuous productivity improvement while maintaining overall team effectiveness.
Task Completion Rate
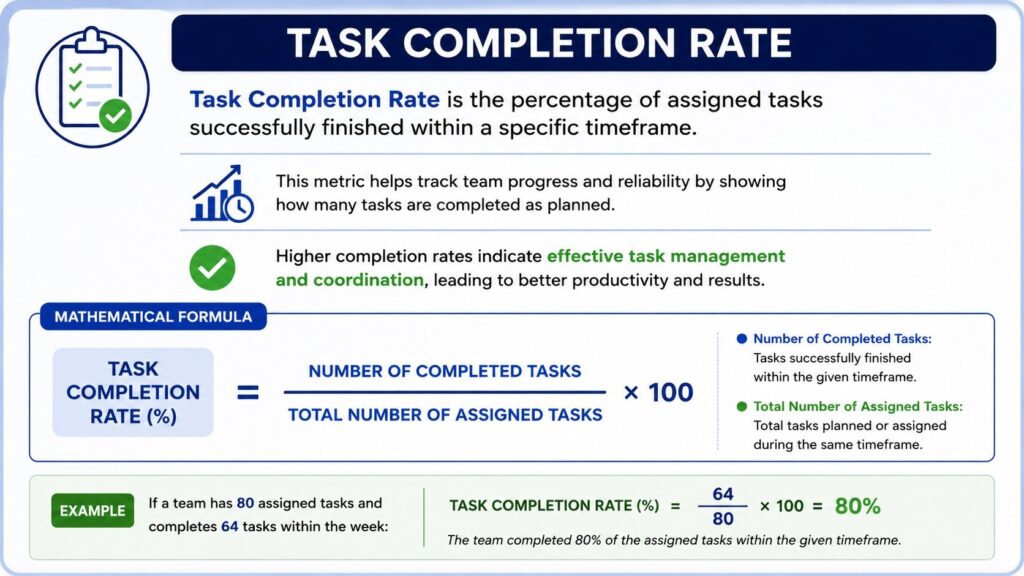
Task completion rate is the percentage of assigned tasks completed within a specific timeframe. It is a key productivity metric that measures how effectively a team completes planned work and meets its commitments.
This metric helps managers track team progress, monitor reliability, and assess whether projects and responsibilities are being completed as expected. By comparing completed tasks against the total number of assigned tasks, organizations can identify performance trends, potential bottlenecks, and opportunities for process improvement.
A high task completion rate generally indicates effective task management, strong coordination, and efficient resource use. Consistently monitoring this metric helps teams maintain accountability, improve workflow efficiency, and achieve their goals more effectively.
Cycle Time
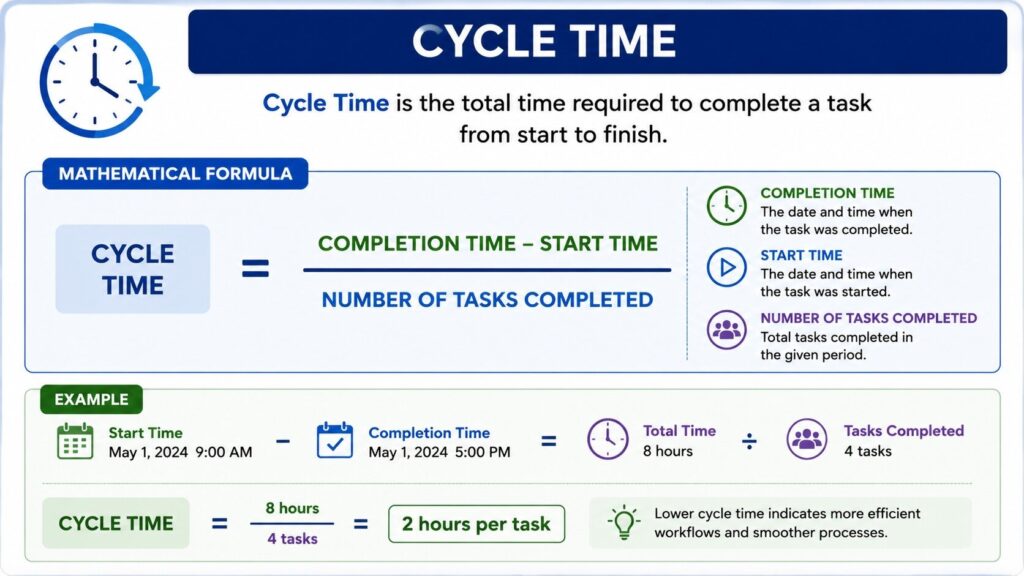
Cycle time is the total amount of time required to complete a task, process, or piece of work from start to finish. It measures how long it takes for work to move through a workflow and reach completion.
Shorter cycle times often indicate efficient workflows, streamlined processes, and effective coordination among team members. When tasks progress smoothly with minimal delays, teams can complete more work in less time and respond more quickly to changing priorities or customer needs.
Monitoring cycle time helps organizations identify bottlenecks, process inefficiencies, and areas where work may be slowing down. By analyzing and reducing cycle time, teams can improve productivity, enhance operational efficiency, and deliver results more consistently.
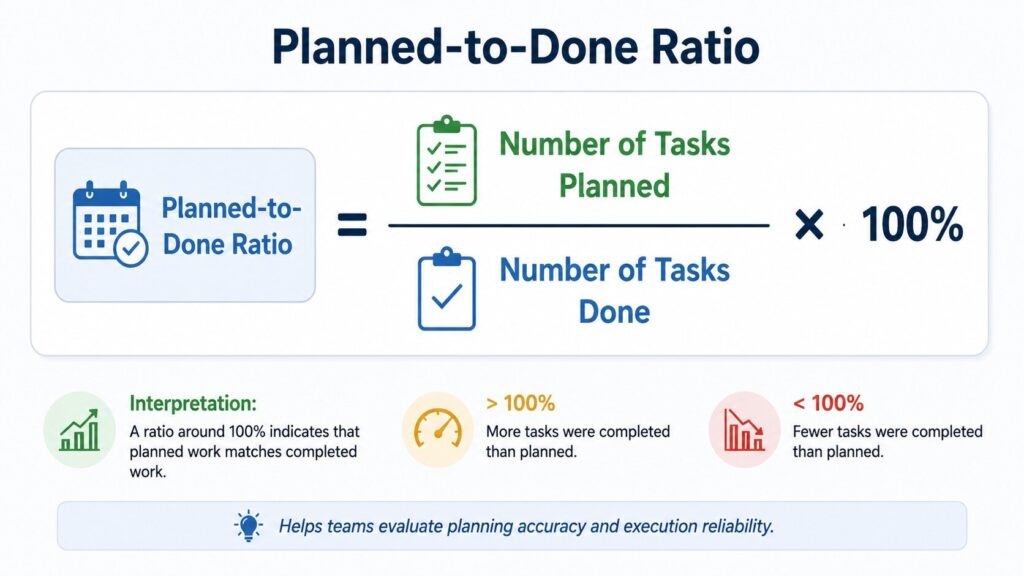
Planned-to-Done Ratio
The planned-to-done ratio is a productivity metric that compares the number of tasks planned for a given period with the number completed during that same period. It helps teams assess how closely their execution matches their original plans and commitments.
Organizations commonly use this metric to evaluate planning accuracy and execution reliability. A significant gap between planned and completed work may indicate unrealistic estimates, resource constraints, shifting priorities, or workflow inefficiencies. By monitoring the planned-to-done ratio, managers can gain insights into how effectively teams translate plans into completed results.
A balanced planned-to-done ratio shows that teams plan work realistically and deliver it consistently. Maintaining healthy ratios helps organizations improve forecasting, strengthen accountability, and support more effective project execution over time.
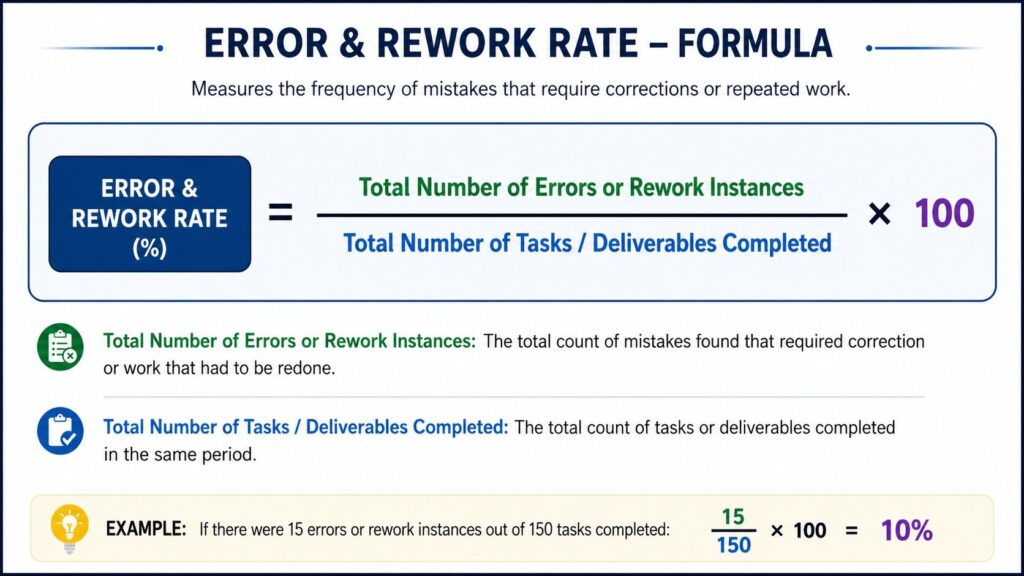
Rework Rate
Error & Rework Rate is a productivity and quality metric that measures how often work contains mistakes that require correction or rework. It reflects the frequency of errors that interrupt the smooth workflow and require additional effort beyond the original task.
This metric is useful for identifying quality issues, skill gaps, unclear requirements, or process weaknesses that may be causing avoidable mistakes. A consistently high error and rework rate often signals inefficiencies in communication, planning, or execution.
Reducing errors and rework improves overall efficiency, saves time and resources, and leads to stronger, more reliable team performance.
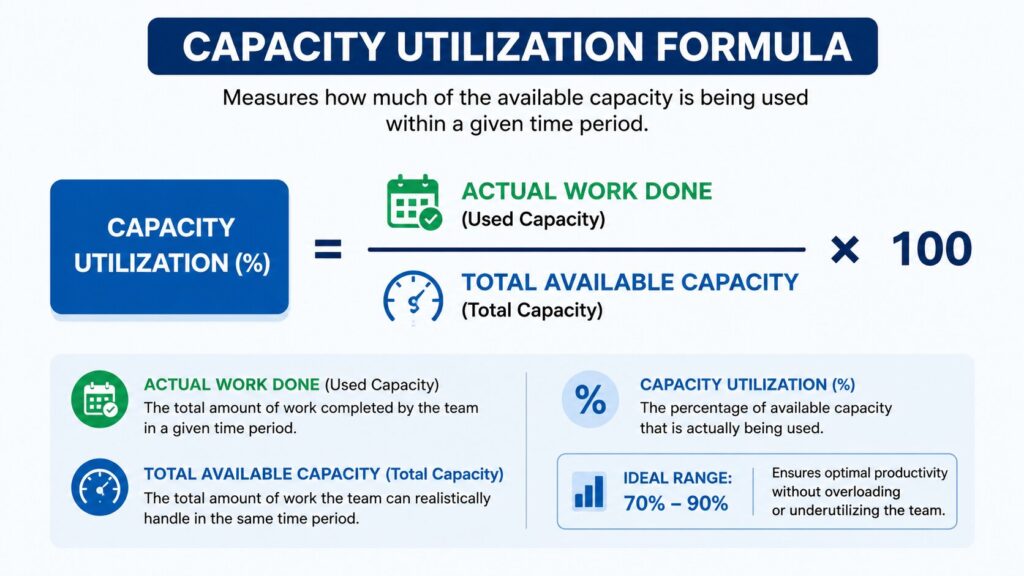
Capacity utilization
Capacity shows how much work a team can realistically handle within a given period. Utilization shows the percentage of that capacity the team uses.
This metric helps managers assess workload distribution and prevent overuse or underuse. It also improves planning, resource allocation, and task efficiency.
Balanced utilization leads to sustainable productivity, where teams can maintain steady performance without burnout or wasted capacity.
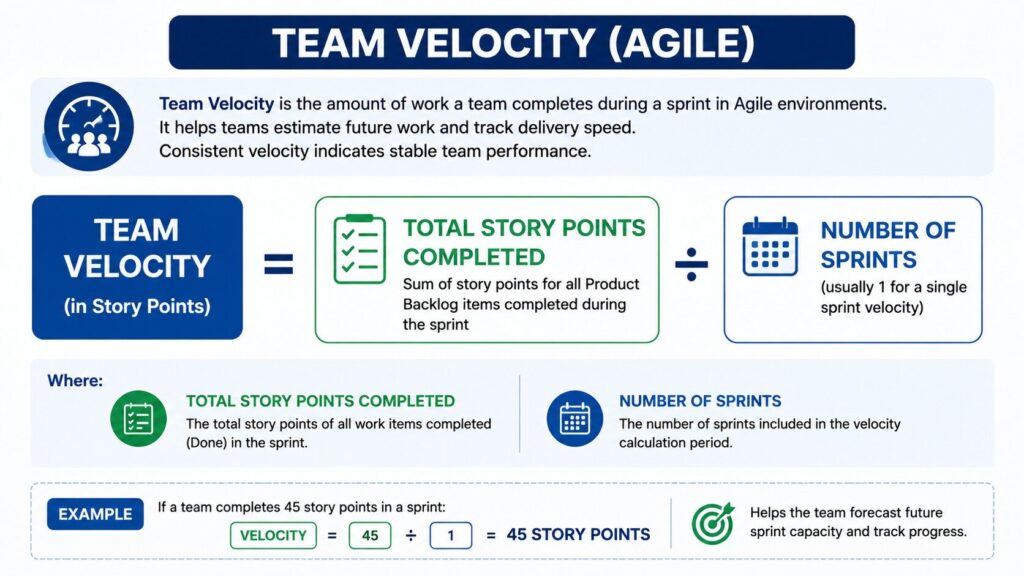
Team Velocity Agile
Team velocity is the amount of work a team successfully completes during a sprint in an Agile environment. Teams typically measure it using story points, task units, or other agreed-upon effort estimates for user stories and tasks.
Velocity helps Agile teams estimate how much work they can realistically deliver in future sprints. By tracking the amount of completed work over time, teams can improve sprint planning, set more accurate delivery expectations, and better manage project timelines.
This metric also provides insight into delivery speed and team capacity, helping stakeholders understand whether the team is progressing at a sustainable pace. Rather than measuring individual performance, velocity focuses on the team's collective ability to deliver value.
A consistent velocity over multiple sprints generally indicates stable team performance, predictable delivery, and a well-balanced workload.
Customer Satisfaction
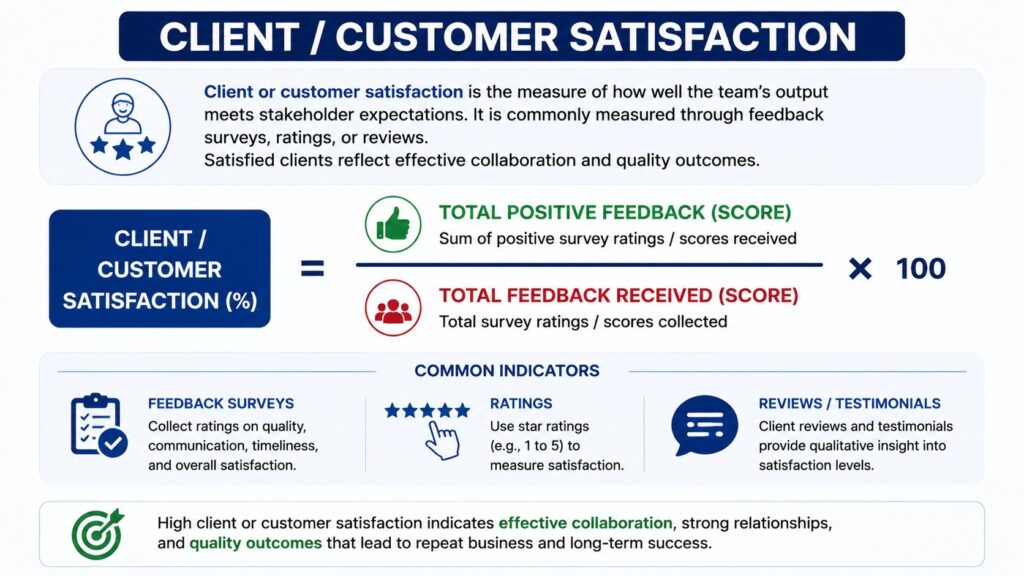
Client or customer satisfaction is the degree to which a team's output meets or exceeds stakeholder expectations. It reflects the perceived quality, value, and effectiveness of the team's products, services, or deliverables.
Common indicators of client or customer satisfaction include feedback surveys, satisfaction ratings, reviews, testimonials, and direct customer feedback. These measures help organizations understand how clients perceive their performance and identify areas for improvement.
Monitoring satisfaction levels enables teams to evaluate service quality, strengthen customer relationships, and ensure that project outcomes align with stakeholder needs. High satisfaction scores often indicate that the team is delivering consistent value and meeting agreed expectations.
Satisfied clients reflect effective collaboration, strong communication, and quality outcomes, making client/customer satisfaction an important indicator of overall team and organizational success.