
Performance management for tech companies is a structured system that aligns engineering, product, and business performance with organizational goals through continuous feedback, role-specific metrics, and agile workflows. It focuses on measuring impact over activity, supporting innovation, and ensuring scalable, fair evaluation across fast-moving, technology-driven environments.
Core Attributes of Performance Management for Tech Companies
Tech-Specific Performance Challenges
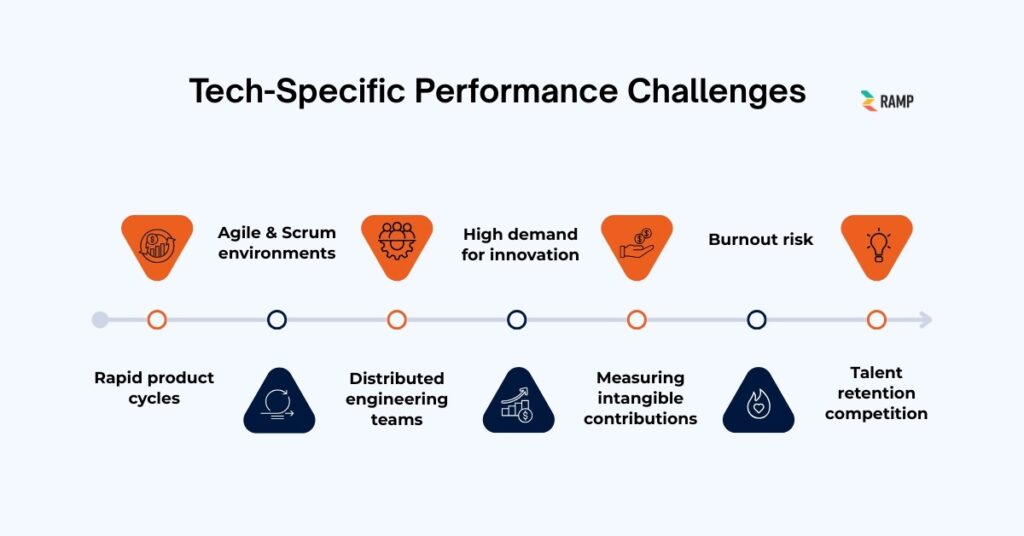
Tech companies operate in a high-speed, high-pressure environment where traditional performance models often fail. The tech-specific performance challenges are shown in the diagram below.
The details include:
- Rapid product cycles: Frequent releases make annual reviews outdated
- Agile & Scrum environments: Work is iterative, not linear
- Distributed engineering teams: Collaboration across locations is complex
- High demand for innovation: Performance must include creativity and problem-solving
- Measuring intangible contributions: Architecture decisions and debugging are hard to quantify
- Burnout risk: Intense workloads can reduce long-term productivity
- Talent retention competition: Skilled engineers have many options
Performance systems must adapt to speed, complexity, and creativity.
Role-Specific KPIs in Tech Companies
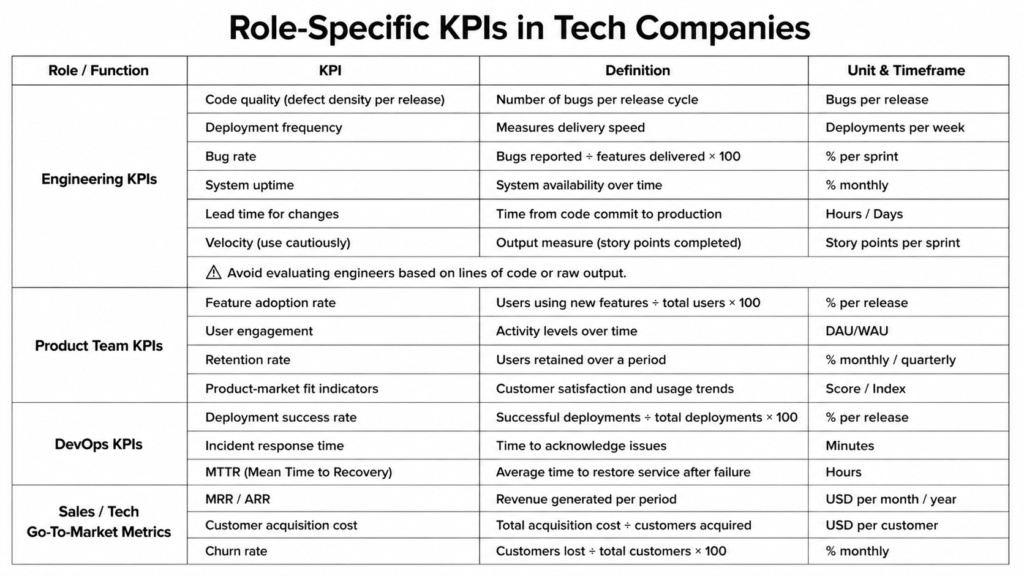
Metrics must reflect the nature of each role, not generic output.
Engineering KPIs
- Code quality (defect density per release): Number of bugs per release cycle
- Deployment frequency (deployments per week): Measures delivery speed
- Bug rate (% per sprint): Bugs reported ÷ features delivered × 100
- System uptime (% monthly): System availability over time
- Lead time for changes (hours/days): Time from code commit to production
- Velocity (story points per sprint): Output measure (use cautiously, not as a sole metric)
⚠️ Avoid evaluating engineers based on lines of code or raw output.
Product Team KPIs
- Feature adoption rate (% per release): Users using new features ÷ total users × 100
- User engagement (daily/weekly active users): Activity levels over time
- Retention rate (% monthly/quarterly): Users retained over a period
- Product-market fit indicators: Customer satisfaction and usage trends
DevOps KPIs
- Deployment success rate (% per release): Successful deployments ÷ total deployments × 100
- Incident response time (minutes): Time to acknowledge issues
- MTTR (Mean Time to Recovery – hours): Average time to restore service after failure
Sales/Tech Go-To-Market Metrics
- MRR/ARR (monthly/annual recurring revenue): Revenue generated per period
- Customer acquisition cost (cost per customer): Total acquisition cost ÷ customers acquired
- Churn rate (% monthly): Customers lost ÷ total customers × 100
The chart below summarizes the role-specific KPIs in Tech Companies.
Agile Performance Management
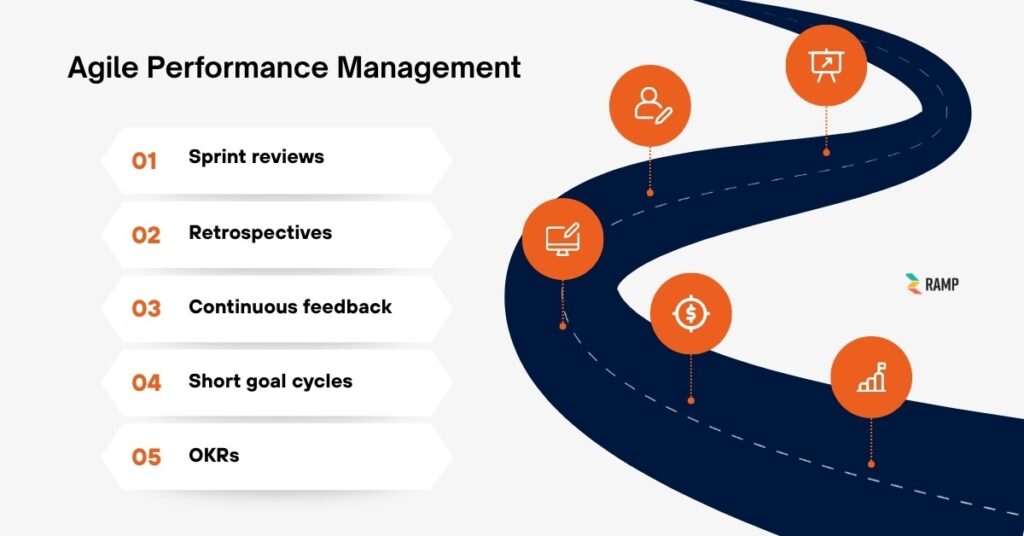
Tech companies embed performance into Agile workflows. The diagram below shows how performance management is integrated into Agile workflows through continuous feedback, short cycles, and regular evaluations.
The details include:
- Sprint reviews: Evaluate delivered work every sprint
- Retrospectives: Reflect on what worked and what didn't
- Continuous feedback: Ongoing instead of periodic reviews
- Short goal cycles: Weekly or quarterly objectives
- OKRs: Align team output with company goals
Performance is not a separate process; it is part of daily work.
Innovation & Impact Measurement
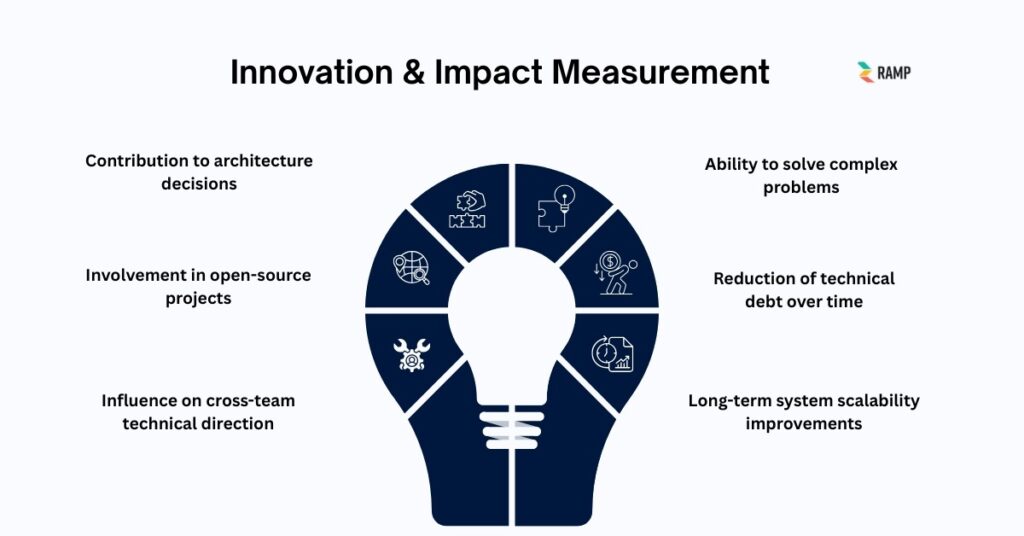
In tech, impact matters more than activity. The diagram below shows how tech companies measure innovation and impact by evaluating meaningful contributions beyond routine activity.
The points include:
- Contribution to architecture decisions
- Involvement in open-source projects
- Influence on cross-team technical direction
- Ability to solve complex problems
- Reduction of technical debt over time
- Long-term system scalability improvements
Measuring innovation requires qualitative judgment supported by outcomes.
Collaboration & Cross-Functional Metrics
Tech work is deeply collaborative. The diagram below shows the key metrics used to evaluate collaboration and cross-functional effectiveness in tech teams.
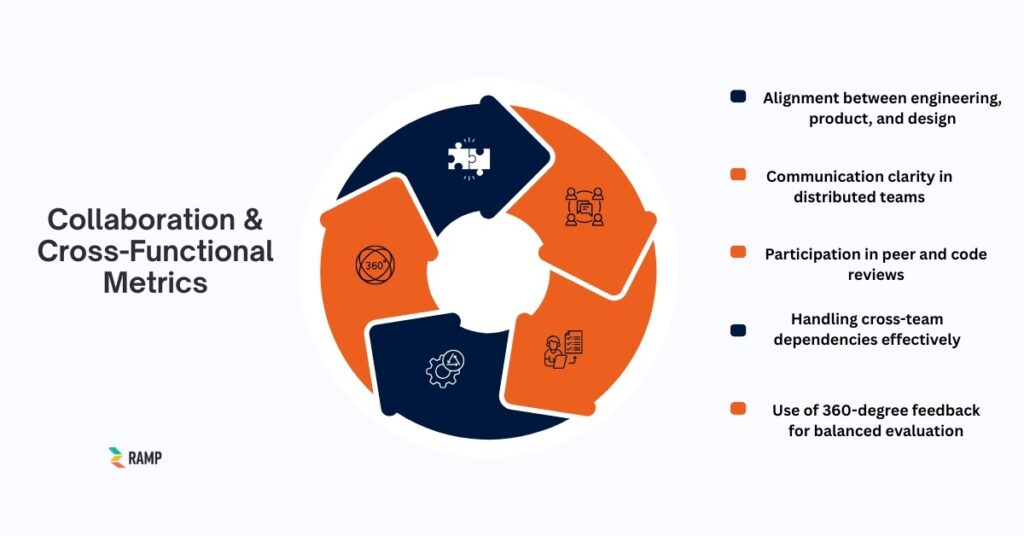
Strong collaboration often determines project success more than individual output.
Remote & Distributed Workforce
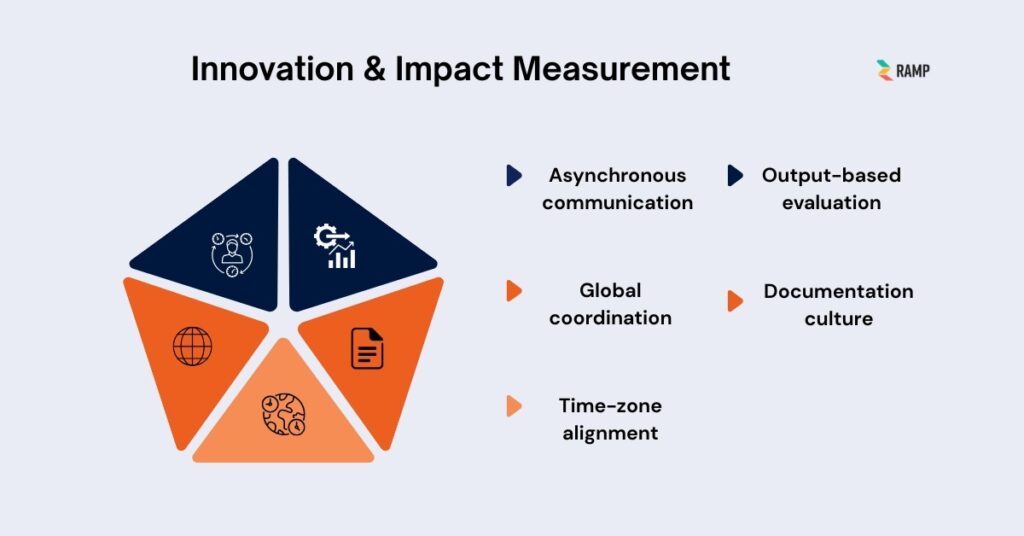
Most tech companies operate with remote or hybrid teams. That's why it's important to be aware of remote performance management. The diagram below shows how performance is managed in remote and distributed teams through flexible, output-focused practices and global coordination.
The details include:
- Asynchronous communication: Work does not depend on real-time presence
- Output-based evaluation: Focus on results, not hours worked
- Global coordination: Teams span multiple time zones
- Documentation culture: Written communication replaces verbal updates
- Time-zone alignment: Clear expectations for availability and delivery
Performance systems must support flexibility without losing accountability.
Performance Review Structure in Tech
Modern tech companies use hybrid evaluation models.
- Continuous performance management with regular check-ins
- Biannual formal reviews for structured evaluation
- Peer feedback to capture team impact
- Self-evaluations to encourage reflection
- Technical competency frameworks defining skill expectations
Leveling frameworks:
- IC1 → IC2 → Senior → Staff → Principal
Each level has clear expectations, ensuring transparency in promotions.
Bias & Fairness in Tech Evaluations
Bias can significantly affect outcomes in tech environments. The diagram below shows the key measures used to ensure fair, bias-free performance evaluations in tech organizations.
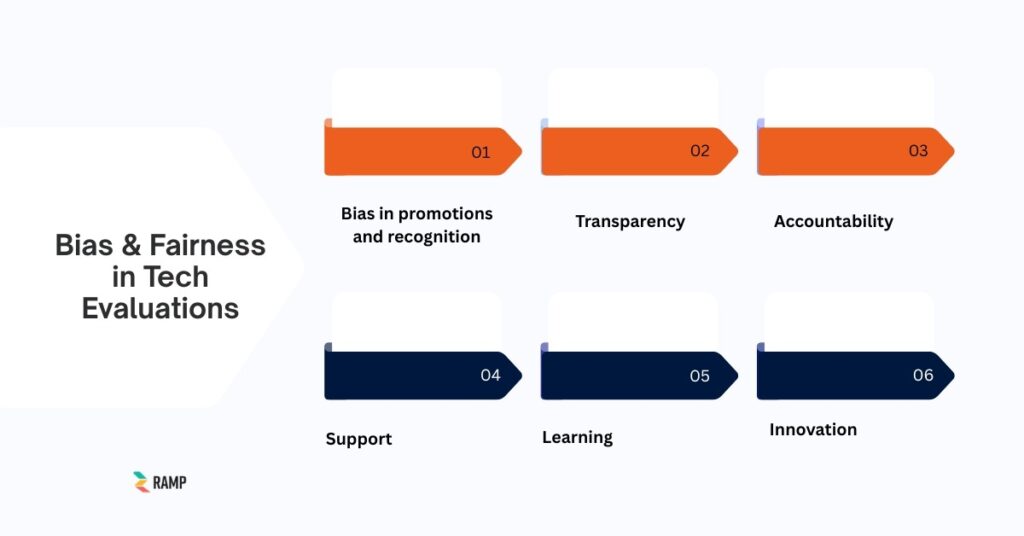
Fair systems improve trust and retention.
Compensation & Equity Linkage
Performance in tech is closely tied to rewards. The following diagram shows how performance in tech companies is linked to compensation and equity to reward outcomes and drive long-term value.
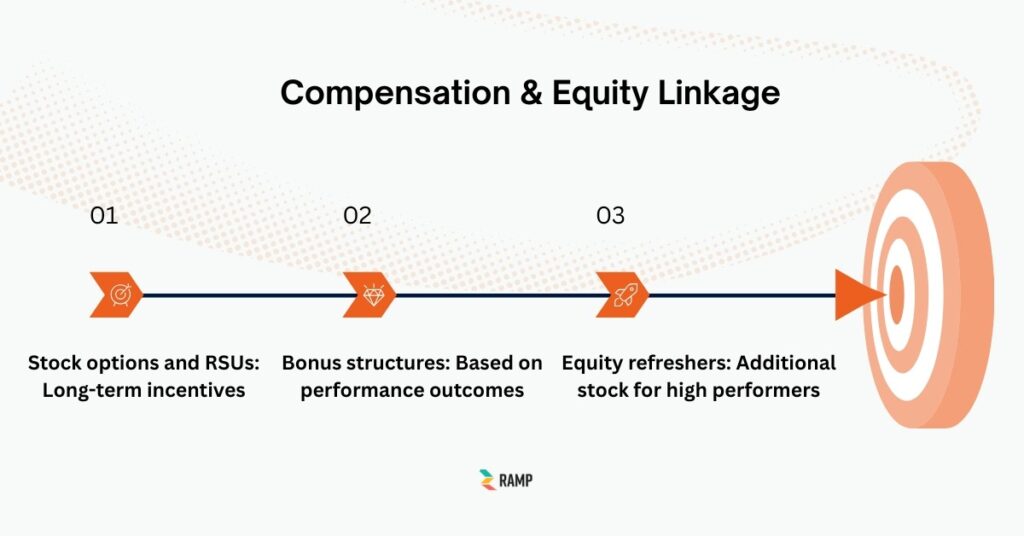
⚠️ Risk: Poorly designed incentives can lead to short-term thinking or unhealthy competition.
Performance Improvement in Tech
Handling underperformance requires care in high-skill environments. Thus, it's important to be aware of effective performance improvement (PIPs).
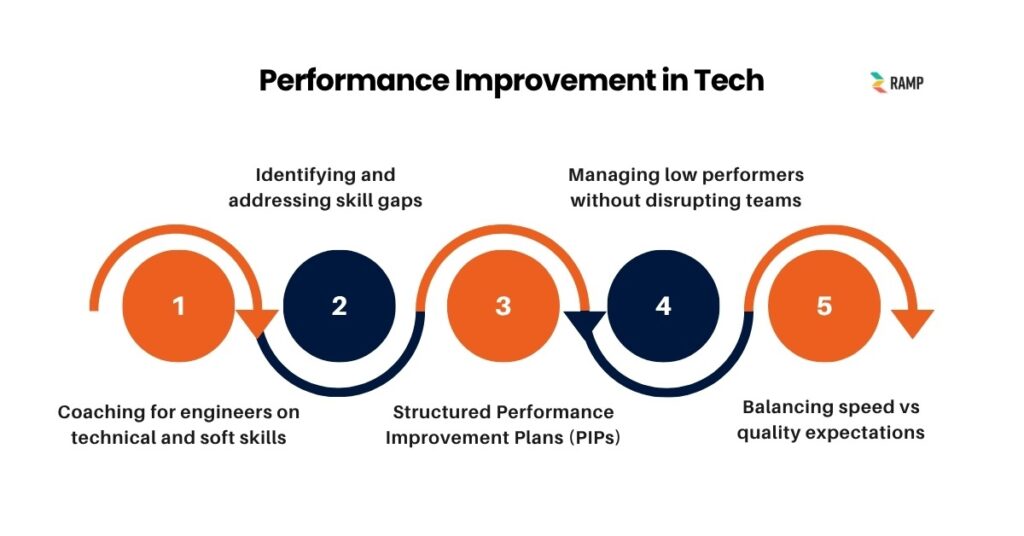
The goal is improvement, not punishment.
Technology & Tools Used in Tech Companies
Performance tracking is integrated into daily tools. The technologies and tools used by tech companies are shown in the diagram below.
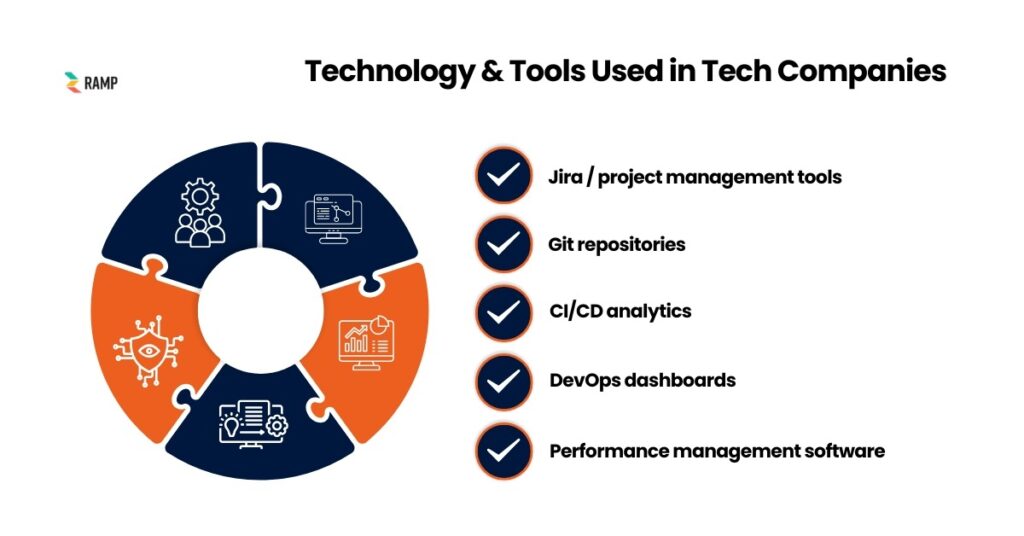
The details are given below.
- Jira / project management tools: Track tasks and sprint progress
- Git repositories: Monitor code contributions and reviews
- CI/CD analytics: Measure deployment efficiency
- DevOps dashboards: Track system performance
- Performance management software: Formal evaluations
Integration ensures data accuracy and reduces manual effort.
Research on Technology’s Impact on the Performance Management Transformation explains how technology, people analytics, and data science are helping performance management become more continuous, flexible, data-driven, and development-focused. However, the authors stress that technology alone cannot transform performance management. Organizations must combine it with effective change strategies and use it to strengthen performance-driving behaviors rather than simply automate outdated processes.
Common Performance Management Mistakes in Tech
The common performance management mistakes in Tech companies are illustrated in the diagram below.
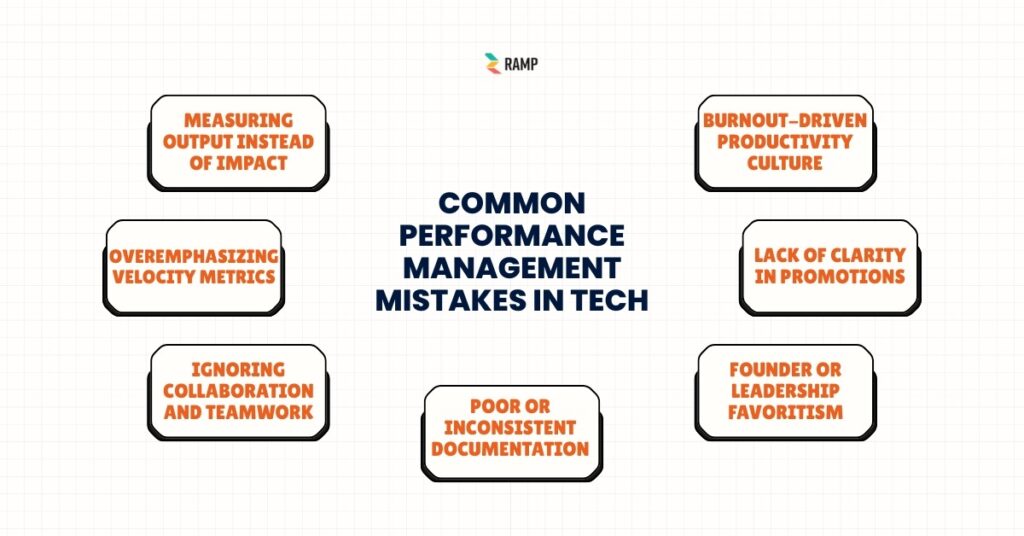
These mistakes damage both performance and morale.
Lifecycle Structure of Performance Management in Tech
A structured lifecycle ensures consistency and alignment:
- Define product and engineering objectives
- Translate objectives into OKRs
- Set role-specific KPIs
- Track sprint-level performance
- Conduct continuous feedback cycles
- Calibrate performance across teams
- Link performance to promotions and compensation
- Analyze performance trends for improvement
Performance management in tech companies is not about counting output; it is about understanding impact, enabling innovation, and aligning fast-moving teams toward meaningful results.